
 Researchers in the Institute for Biodiversity and Ecosystem Dynamics (IBED) at the University of Amsterdam have been studying the páramos and Andean ecosystems for over 50 years. These highly diverse ecosystems are currently restricted to mountain-tops (resembling an archipelago of islands in the sky), but in the past dominated large surface areas throughout the Northern Andes. Climate change determined the degree of páramo fragmentation and connectivity in the past, and site-specific results have been integrated into a GIS-environment (visualization) for southern Colombia and the entire Northern Andes by IBED researchers Suzette Flantua and Henry Hooghiemstra.
Watch the ‘Time machine: Ice ages in the Andes’ video and see its presentation at the recent IBED Open Day:
 Catalina Giraldo (supported by Huge de Vries foundation) is developing a project called ‘Time machine: Ice ages in the Andes’ in a collaboration between the Department of Ecosystem and Landscape Dynamics and the Master in Media Design-Lens based at Piet Zwart Institute in Rotterdam University of Applied Sciences. This project aims to display scientific information using 3D animation to visualize ecosystems in the past – both spatially and temporally. The convergence between science, art, and technology is considered a pathway for innovative education models that explore theories from different disciplines and engage researchers from an array of scientific fields.
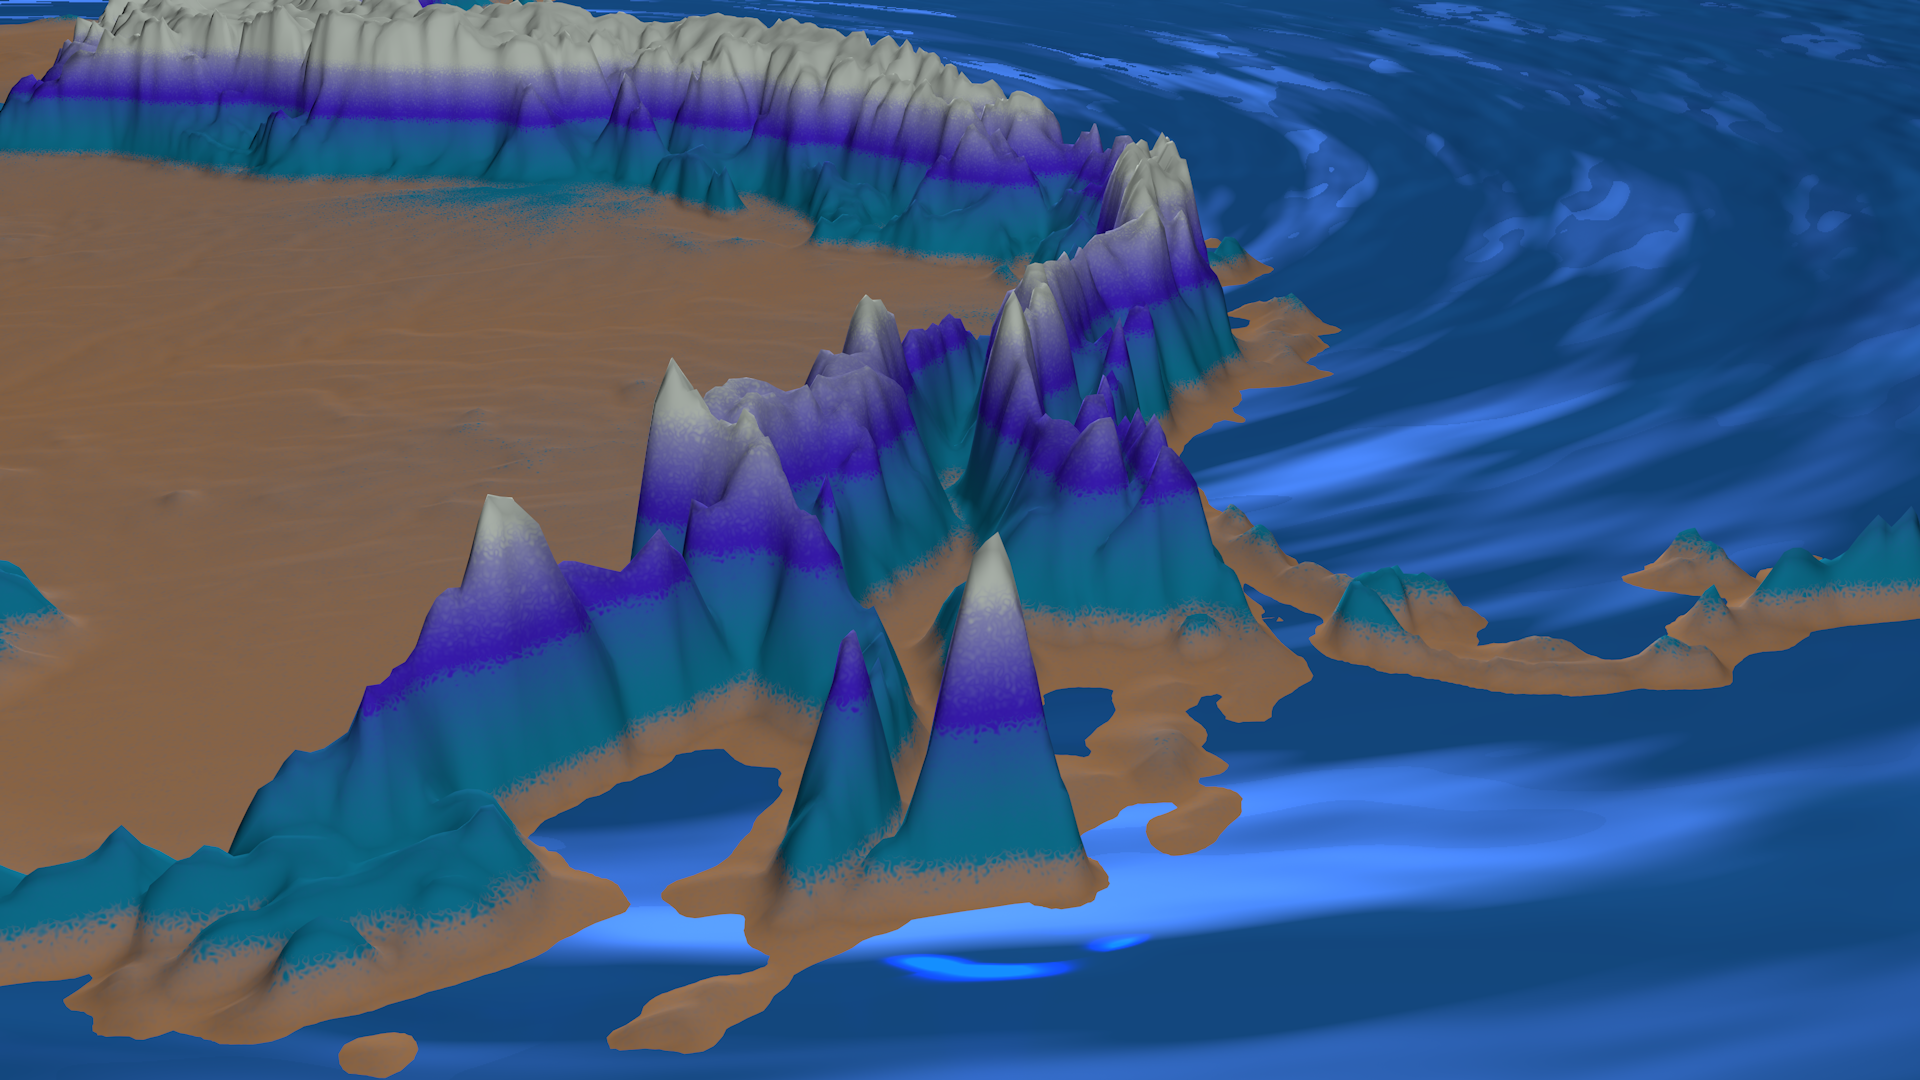
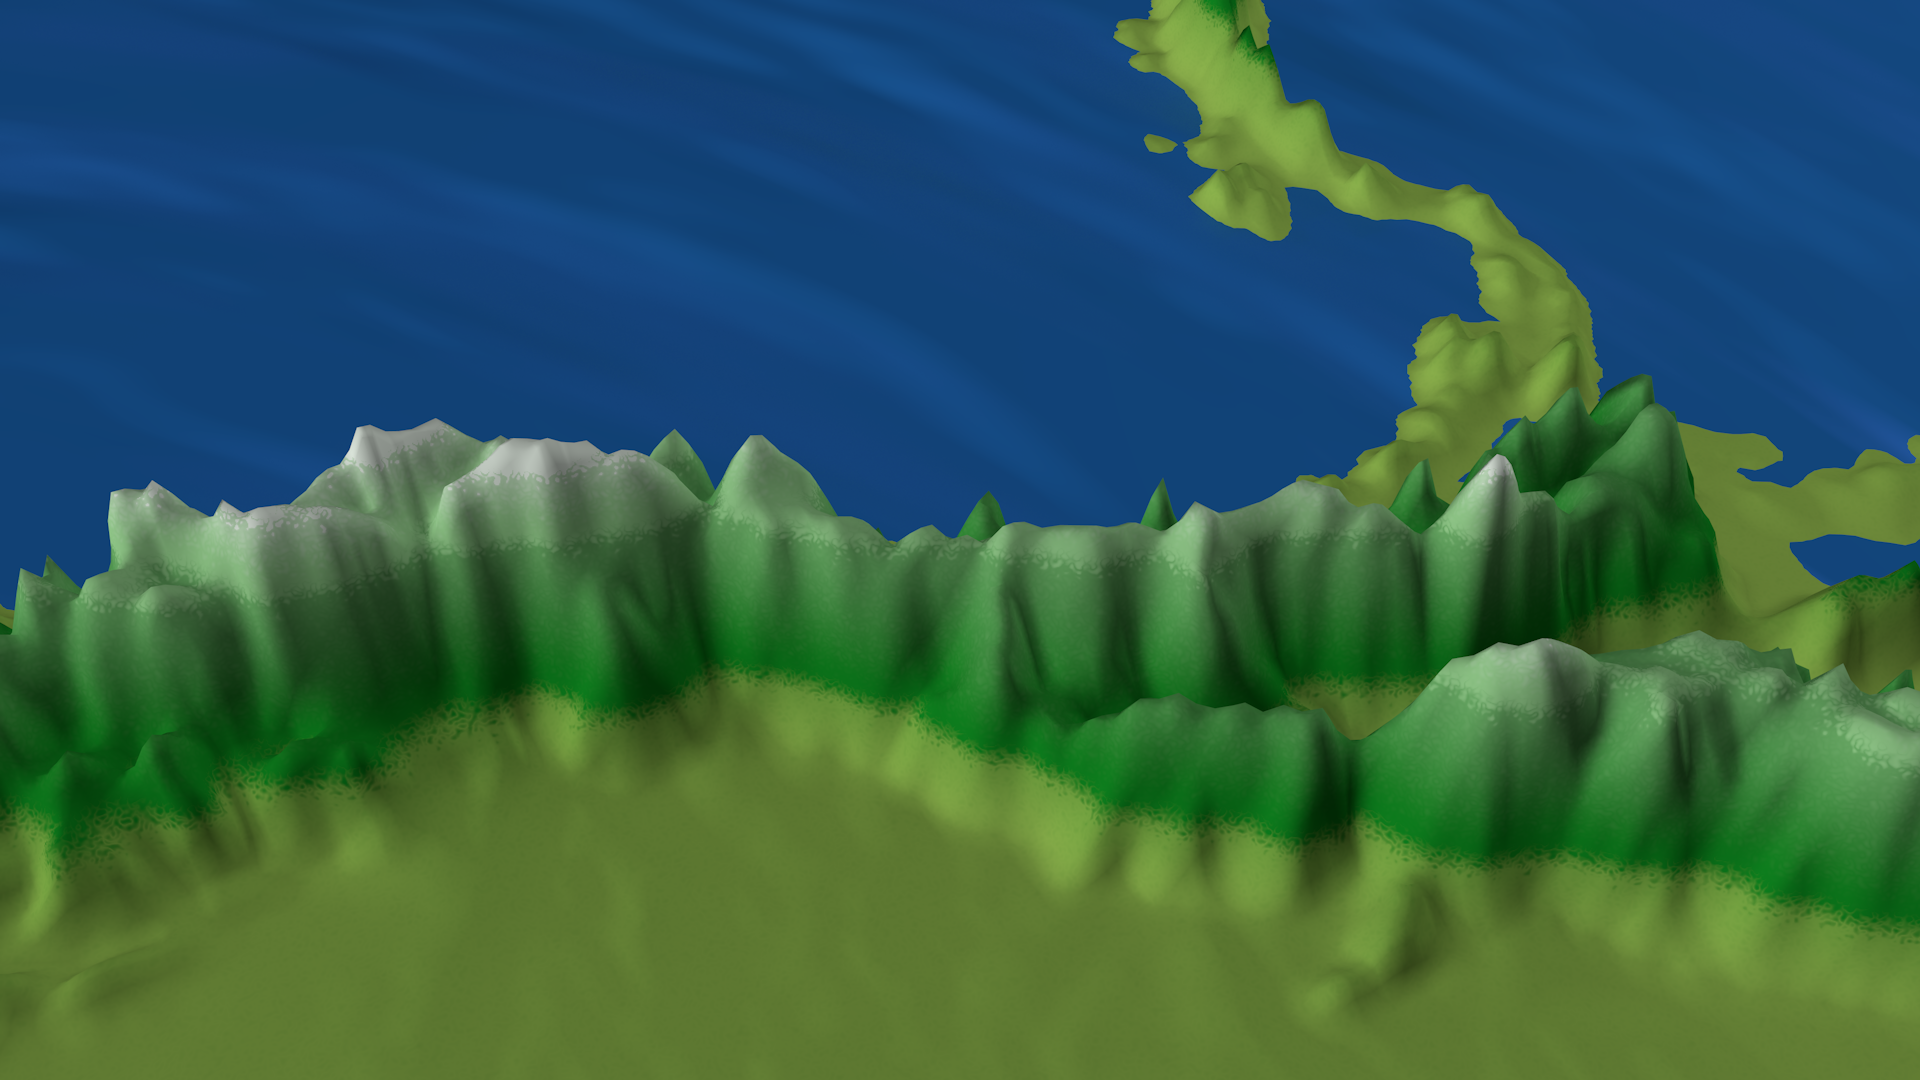 Using software for animation and film (Cinema 4D, After Effects and Premier), Catalina Giraldo and Seringe Huisman presented preliminary results from the project at the IBED’s Open Day (October 2017). Catalina displayed a 3D animation of the shifting elevational distributions of the páramos, Andean forests, and lowland forests over the last 1 million years. It was complemented by photography of Colombian páramos and plants species in modern times. As part of the demonstration, Seringe and Catalina explained the scientific data driving the visualizations – pollen assemblages identified from lake sediment records. And identifying pollen and other microfossils from archives of past change is a major part of the research currently going on in the Department of Ecosystem and Landscape Dynamics .
